Prometheus Monitoring and System Optimization
Prepared by: Anwer Sadath Abdul Muttaliff
Prepared by: Anwer Sadath Abdul Muttaliff
This project demonstrates how to set up Prometheus, Grafana, and Node Exporter for system monitoring, perform stress testing using stress-ng, and optimize system performance through kernel tuning and swap management.
Prometheus is an open-source monitoring and alerting toolkit. It collects metrics (e.g., CPU usage, memory usage) from your system and stores them in a time-series database. It uses a pull-based model, meaning it periodically scrapes metrics from targets (e.g., Node Exporter).
Grafana is an open-source visualization tool. It connects to data sources (e.g., Prometheus) and creates beautiful dashboards to display metrics in real-time. It’s highly customizable and supports alerts.
Node Exporter is a Prometheus plugin that collects system-level metrics (e.g., CPU, memory, disk, network) from Linux machines. It exposes these metrics in a format that Prometheus can scrape.
stress-ng is a tool to stress-test your system by simulating high CPU, memory, disk, or I/O load. It helps you understand how your system behaves under pressure.
Launch two Linux instances with the following IP addresses:
192.168.1.88192.168.1.87Configure the firewall on the first instance:
firewall-cmd --permanent --add-port=9090/tcp  # Prometheus
firewall-cmd --permanent --add-port=3000/tcp  # Grafana
firewall-cmd --permanent --add-port=9100/tcp  # Node Exporter
On the second instance, install Node Exporter and configure the firewall:
firewall-cmd --permanent --add-port=9100/tcpUpdate the system and install stress-ng and wget:
sudo yum update -y
sudo yum install -y stress-ng wgetDownload Prometheus:
wget https://github.com/prometheus/prometheus/releases/download/v2.47.0/prometheus-2.47.0.linux-amd64.tar.gzExtract and move Prometheus to /opt/prometheus:
tar -xvzf prometheus-2.47.0.linux-amd64.tar.gz
sudo mv prometheus-2.47.0.linux-amd64 /opt/prometheusCreate a prometheus.yml configuration file:
global:
  scrape_interval: 15s

scrape_configs:
  - job_name: 'node-localhost'
    static_configs:
      - targets: ['192.168.1.88:9100']

  - job_name: 'node-remote'
    static_configs:
      - targets: ['192.168.1.87:9100']
Start Prometheus:
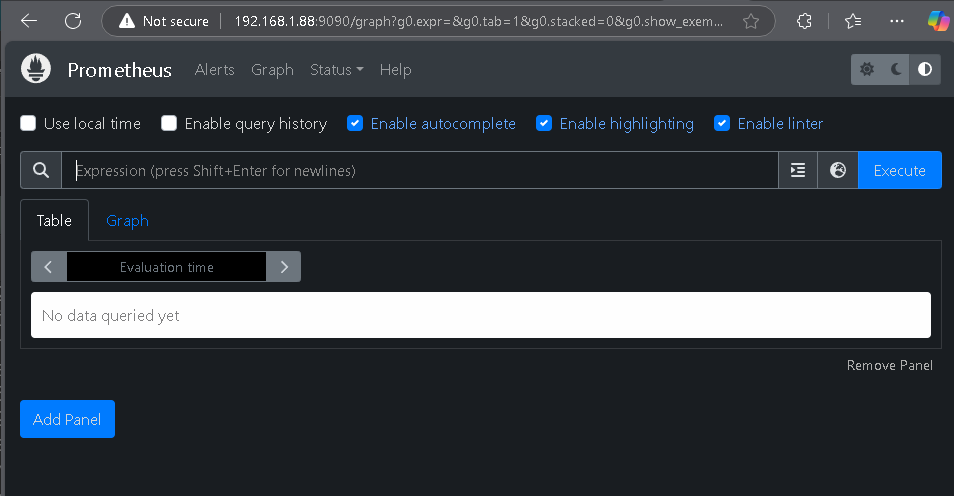
./prometheus --config.file=prometheus.yml &Verify Prometheus is running by accessing http://<IP>:9090.
Download Node Exporter:
wget https://github.com/prometheus/node_exporter/releases/download/v1.6.1/node_exporter-1.6.1.linux-amd64.tar.gzExtract and move Node Exporter to /usr/local/bin:
tar -xvzf node_exporter-1.6.1.linux-amd64.tar.gz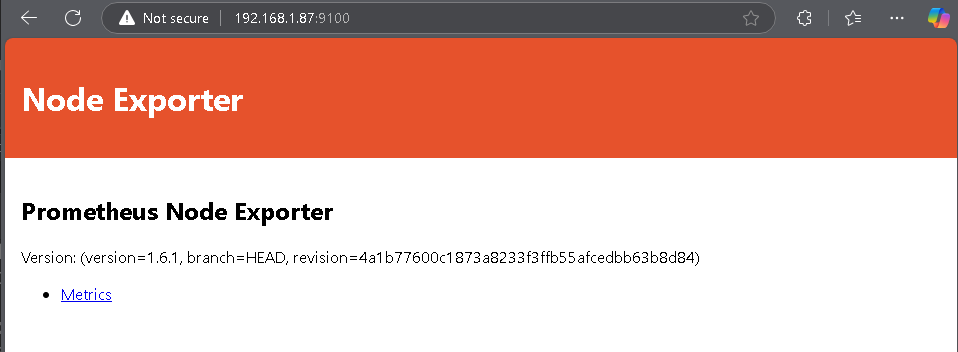
sudo mv node_exporter-1.6.1.linux-amd64/node_exporter /usr/local/bin/Run Node Exporter:
sudo node_exporter &Verify Node Exporter is running by accessing http://<IP>:9100/metrics.
Download Grafana:
wget https://dl.grafana.com/oss/release/grafana-10.1.5.linux-amd64.tar.gzExtract and move Grafana to /opt/grafana:
tar -xvzf grafana-10.1.5.linux-amd64.tar.gz
sudo mv grafana-10.1.5 /opt/grafanaRun Grafana:
cd /opt/grafana
./bin/grafana-server &
Access Grafana at http://<IP>:3000 and log in with the default credentials (admin/admin).
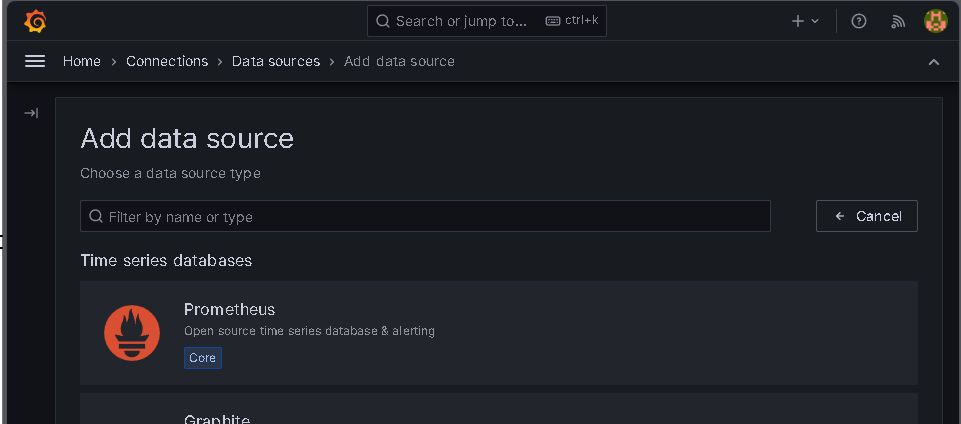
Go to Configuration > Data Sources, add Prometheus, and set the URL to http://localhost:9090.
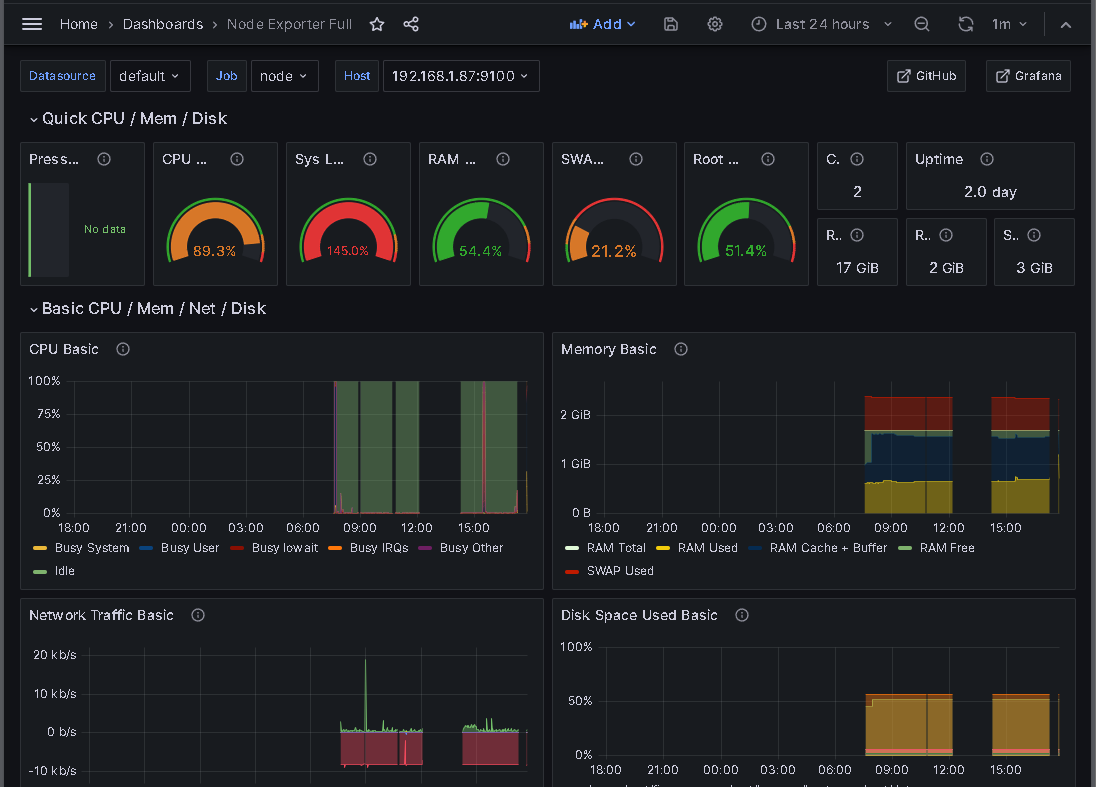
Import the Node Exporter Full dashboard (ID: 1860) and select the Prometheus data source.
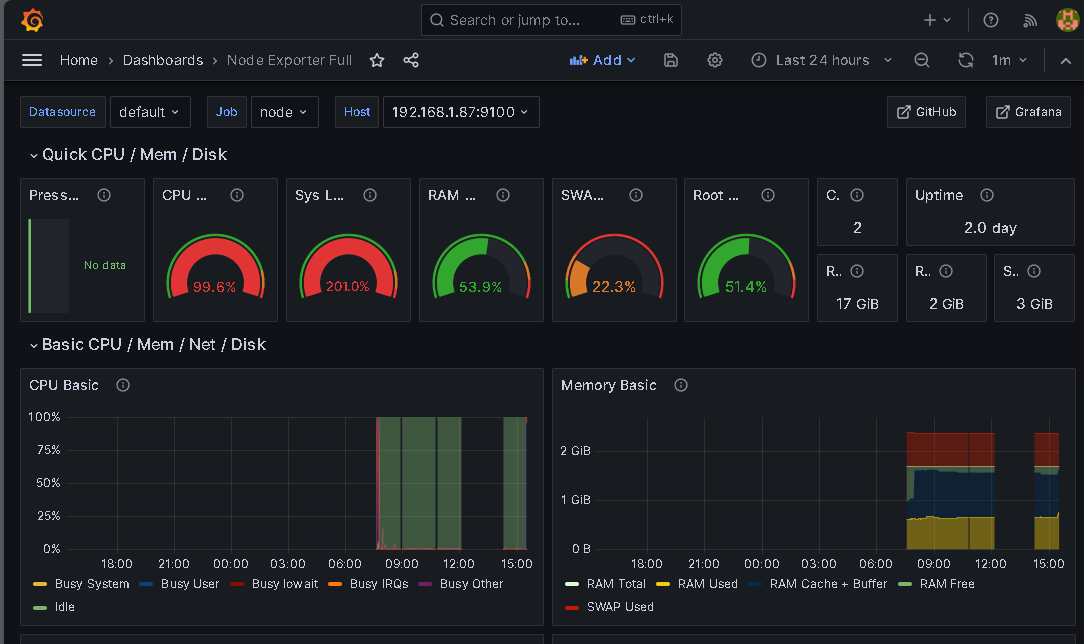
Run stress-ng to simulate high CPU usage:
stress-ng --cpu 4 --timeout 300sObserve the impact on CPU usage in Grafana.
Before sysctl adjustment:
After sysctl adjustment:
Edit /etc/sysctl.conf:
sudo nano /etc/sysctl.confAdd the following lines:
# Increase the number of open files
fs.file-max = 100000

# Optimize network performance
net.core.somaxconn = 1024
net.core.netdev_max_backlog = 5000
net.ipv4.tcp_max_syn_backlog = 1024
Apply the changes:
sudo sysctl -pIncrease swap space to improve system performance:
dd if=/dev/zero of=/root/swapblk bs=1M count=1000
mkswap /root/swapblk
chmod 0600 /root/swapblk
swapon /root/swapblk
Verify the new swap space:
free -m